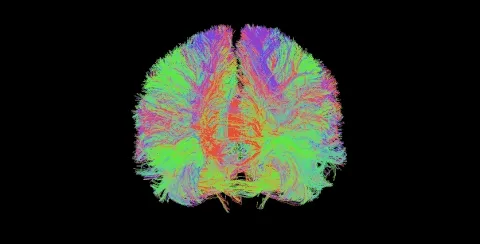
Detecting Brain Regions Associated with Autism Development

Inspiration
Brain connectomics or brain network research has rapidly expanded using functional MRI (fMRI) and diffusion-weighted MRI (dwMRI). A common product of these varied analyses is a connectivity matrix (CM). A CM stores the connection strength between any two regions (“nodes”) in a brain network. This format is useful for several reasons:
- it is highly distilled, with minimal data size and complexity
- graph theory can be applied to characterize the network’s topology
- it retains sufficient information to capture individual differences such as age, gender, intelligence quotient (IQ), or disease state
In this project, the connectivity matrices of patients diagnosed with autism spectrum disorder (ASD) and typically developing (TD) autism are compared using graph statistical algorithms to determine regions of the brain associated with development of autism.
Statistical Analysis
This analysis relies on a simplified 2-complex based order d Forman–Ricci curvature [1] of an edge is given by:
The difference of the curvatures is found between a pair of autism spectrum disorder (ASD) and typically developing (TD) autism connectivity matrices each constructed by taking the aggregated mean of all such similar samples corresponding to each diagnosis.
Results
Top 10 Statistically Significant Curvature Differences
It is important to note that some connections may occur in the same region of the brain, hence it may seem like a vertex is connected to itself which is not the case.
5 Most Negative Curvatures
| Connected Region | Curvature Difference |
|---|---|
| Right Putamen, Right Insular Cortex | -2331330.433152141 |
| Right Insular Cortex, Right Insular Cortex | -1994182.8538039196 |
| Right Frontal Pole, Right Frontal Orbital Cortex | -1845748.8731592936 |
| Right Frontal Pole, Right Frontal Pole | -1716334.5267126393 |
| Right Insular Cortex, Right Insular Cortex | -1614932.5721171317 |
5 Most Positive Curvatures
| Connected Region | Curvature Difference |
|---|---|
| Left Central Opercular Cortex, Left Central Opercular Cortex | 1934234.5367499162 |
| Right Insular Cortex, Right Putamen | 1971224.916725241 |
| Left Thalamus, Brain-Stem | 2294358.294582237 |
| Right Frontal Pole, Right Frontal Orbital Cortex | 2565673.39796964 |
| Left Middle Temporal Gyrus posterior division, Left Middle Temporal Gyrus posterior division | 3425965.9113210947 |
Discussion
The ten connections between the brain yielding statistically significant results (from most significant to least significant) towards the development of autism are:
- Left Middle Temporal Gyrus posterior division, Left Middle Temporal Gyrus posterior division
- Right Frontal Pole, Right Frontal Orbital Cortex
- Right Putamen, Right Insular Cortex
- Left Thalamus, Brain-Stem
- Right Insular Cortex, Right Insular Cortex
- Right Insular Cortex, Right Putamen
- Left Central Opercular Cortex, Left Central Opercular Cortex
- Right Frontal Pole, Right Frontal Orbital Cortex
- Right Frontal Pole, Right Frontal Pole
- Right Insular Cortex, Right Insular Cortex
Connections Visualized
Replicate Results
Visit the repo for more information.
After running the analysis, the output will be the top 5 most positive and top 5 most negative edges based on curvature difference:
| Connected Regions | Curvature Difference | Type |
|---|---|---|
| Right Putamen ↔ Right Insular Cortex | -2,331,330.43 | Negative |
| Right Insular Cortex ↔ Right Insular Cortex | -1,994,182.85 | Negative |
| Right Frontal Pole ↔ Right Frontal Orbital Cortex | -1,845,748.87 | Negative |
| Right Frontal Pole ↔ Right Frontal Pole | -1,716,334.53 | Negative |
| Right Insular Cortex ↔ Right Insular Cortex | -1,614,932.57 | Negative |
| Left Central Opercular Cortex ↔ Left Central Opercular Cortex | 1,934,234.54 | Positive |
| Right Insular Cortex ↔ Right Putamen | 1,971,224.92 | Positive |
| Left Thalamus ↔ Brain-Stem | 2,294,358.29 | Positive |
| Right Frontal Pole ↔ Right Frontal Orbital Cortex | 2,565,673.40 | Positive |
| Left Middle Temporal Gyrus posterior division ↔ Left Middle Temporal Gyrus posterior division | 3,425,965.91 | Positive |
References
[1] Chatterjee, T., Albert, R., Thapliyal, S. et al. Detecting network anomalies using Forman–Ricci curvature and a case study for human brain networks. Sci Rep 11, 8121 (2021). https://doi.org/10.1038/s41598-021-87587-z
👥 Collaborators
- Dr. Tanima Chatterjee (Boston University)